
To get to this page, to to Reports → Spam Filter.
This report lets you see a summary of counts of received messages against time and how many were detected as spam and how many were detected as not-spam by the VPOP3 spam filter.
This report requires Historical Logging to be enabled.
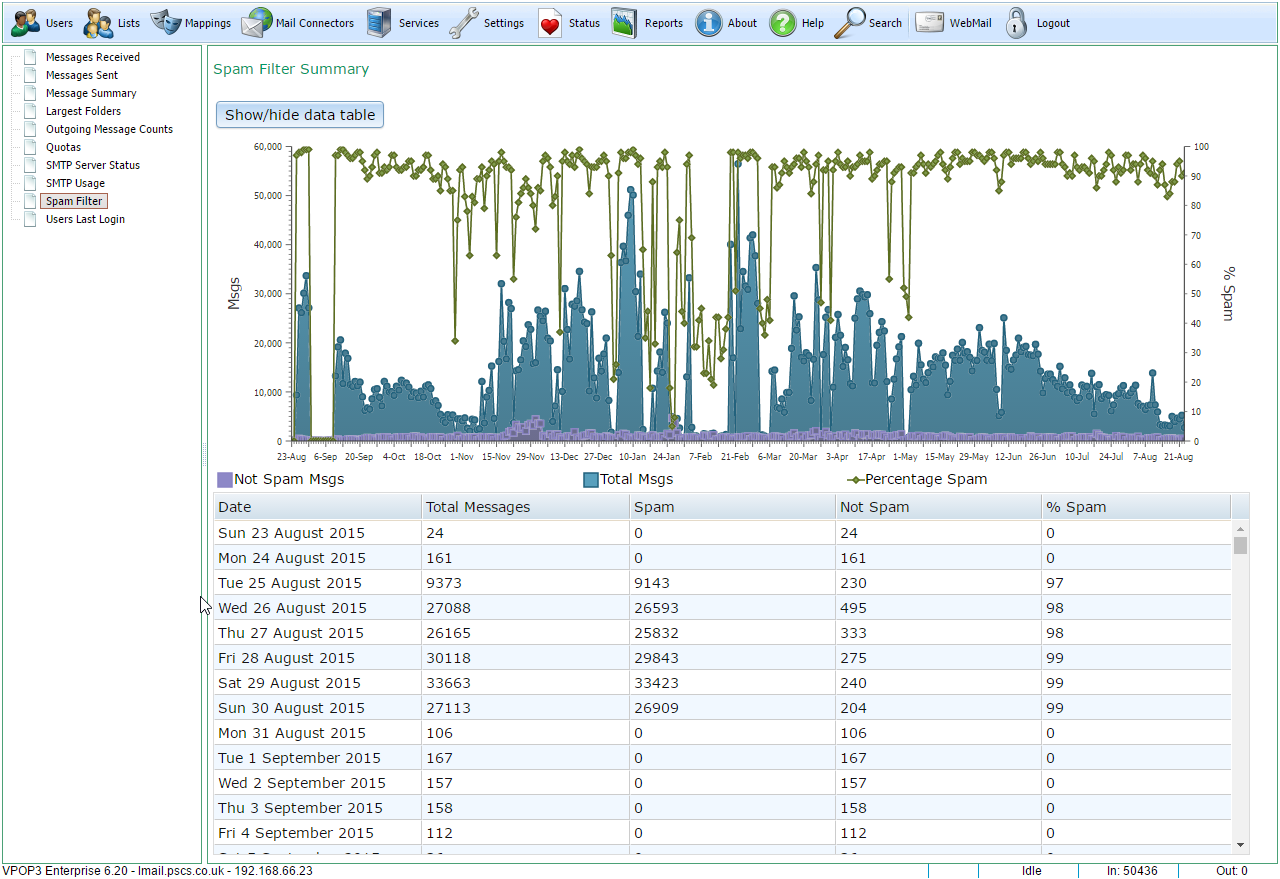
The graph shows the amount of not-spam messages in purple, spam messages in blue and the percentage of spam detected in green (as indicated by the legend below the graph).
The graph is 'active'. If you hover the mouse over a data-point on the graph it will display the value at that time. You can use the scroll-wheel on your mouse to zoom in and out on the date axis, and, when zoomed-in, you can drag with the mouse to move the graph around.
Below the graph is a table of data grouped by date. You can show or hide the table by clicking the Show/hide data table button.
We are always open to suggestions for other reports to add, as long as they will be generally useful to other VPOP3 users, not too complex, and the relevant data can be captured without adversely affecting performance or disk usage. Please contact us with your detailed suggestion. The current reports are reports which have been requested by users or which we have found useful ourselves. |

