
To get to this page, to to Reports → Outgoing Message Counts
This report shows you the number & size of outgoing messages against time.
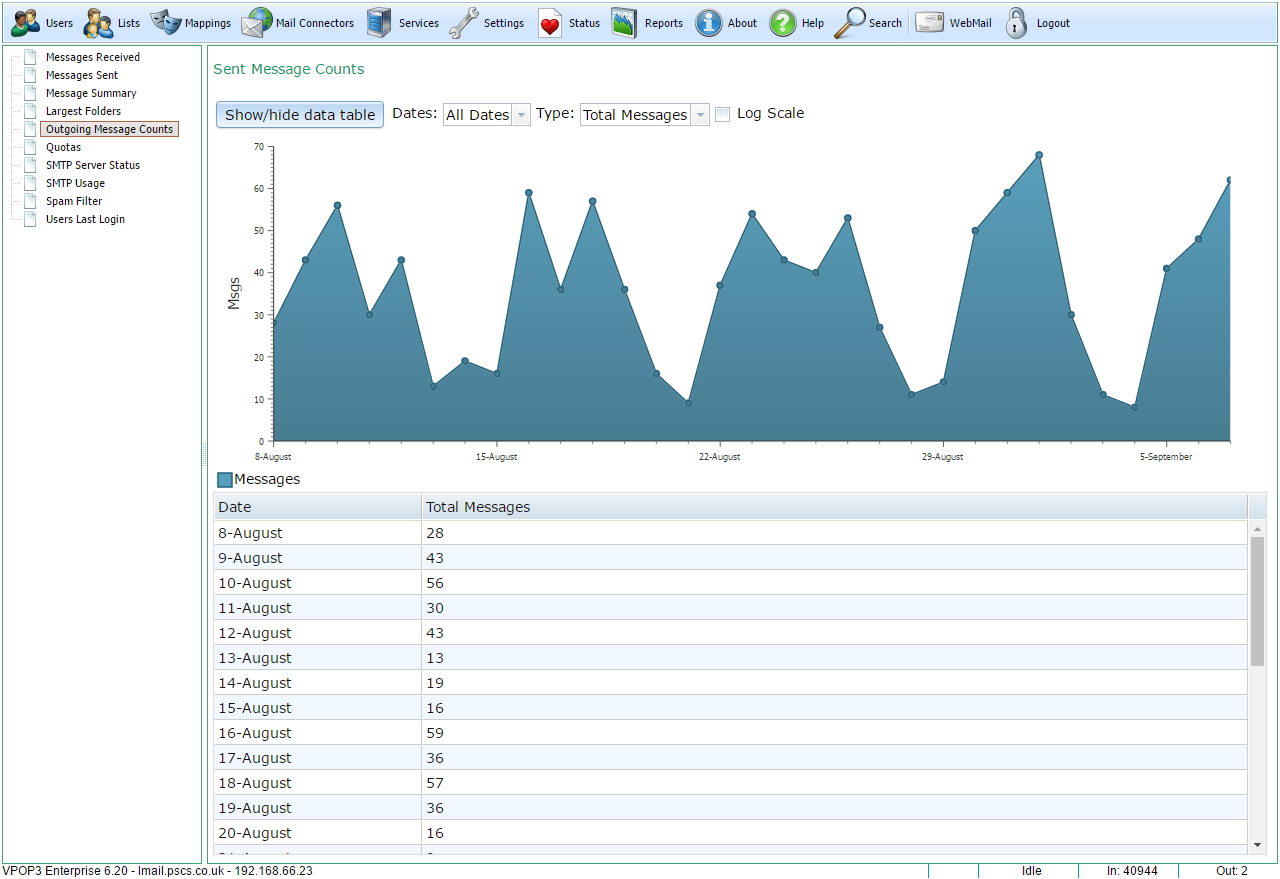
The graph shows either the number of messages, number of recipients, size or recipients x size on the Y axis against date or time on the X axis. If you check the Log Scale box then the Y axis is displayed using a logarithmic scale which can help even out the graph if there are massive variations over time.
If you press the Show/hide data table button, the page will display or hide a table showing the raw data.
If you choose All Dates in the Dates selector, then the graph will show the usage on the Y axis against the date on the X axis. If you select a particular date then the graph will show the usage on the Y axis against the time on the X axis.
On the Y axis you can choose to display:
•Total Messages - the total number of messages sent in the time period
•Total Size - the total size of messages sent in the time period (in bytes)
•Recipients - the number of recipients messages were sent to in the time period
•Recipients x size - the message sizes multiplied by the number of recipients for the time period (in recipient bytes)
So, if you sent two messages, one of 1000 bytes to a single recipient, and one of 2000 bytes to one recipient and copied to another (two total recipients), the values displayed would be:
•Total Messages - 2
•Total Size - 3000 bytes
•Recipients - 3
•Recipients x size - 5000 recipient bytes (1 x 1000 + 2 x 2000)
